
Mit der Veröffentlichung der letzten Quartalszahlen von Facebook am 24.07.2013 wurden auch gleichzeitig die aktualisierten Zahlen zur Facebook Nutzung veröffentlicht. Die aktuellen Zahlen zeigen das beste Umsatz-Ergebnis überhaupt. Facebook wächst nach wie vor und macht in vielen Bereichen Boden gut. Offensichtlich zeigen die Zahlen auch, dass die Plattform noch stärker mobil genutzt wird und die Mobilenutzung sehr […]
Mit der Veröffentlichung der letzten Quartalszahlen von Facebook am 24.07.2013 wurden auch gleichzeitig die aktualisierten Zahlen zur Facebook Nutzung veröffentlicht. Die aktuellen Zahlen zeigen das beste Umsatz-Ergebnis überhaupt. Facebook wächst nach wie vor und macht in vielen Bereichen Boden gut. Offensichtlich zeigen die Zahlen auch, dass die Plattform noch stärker mobil genutzt wird und die Mobilenutzung sehr gut monetarisiert werden kann. Der Anteil von Mobile-Advertising im Umsatz ist auf satte 41% angestiegen (Q1/2013 ) 30% / Q4/2012 = 23% / Q3/2012 = 14%)
Facebook verzeichnete in Q2/2013 1.155 Mrd. Nutzer ( Q1/2013 = 1.110 Mrd.), 198 Mio. in USA und Kanada (Q1/2013 = 195), 272 Mio. in Europa (Q1/2013 = 269 Mio.), 339 Mio. in Asien (Q1/2013 = 319 Mio.), 346 Mio. in den restlichen Regionen (Q1/2013 = 327 Mio.). Der Zuwachs gegenüber Q2/2012 zu Q2/2013 beträgt 20.94%. Der Zuwachs von Q1/2013 zu Q2/2013 rund 4.05%. Die Zahlen zeigen, dass der Zuwachs in USA/Canada und Europa gering ist, dafür Asien und der Rest der Welt aktuell sehr schnell wachst (+20 Mio. Nutzer in Asien / +19 Mio. Nutzer in den restlichen Regionen)
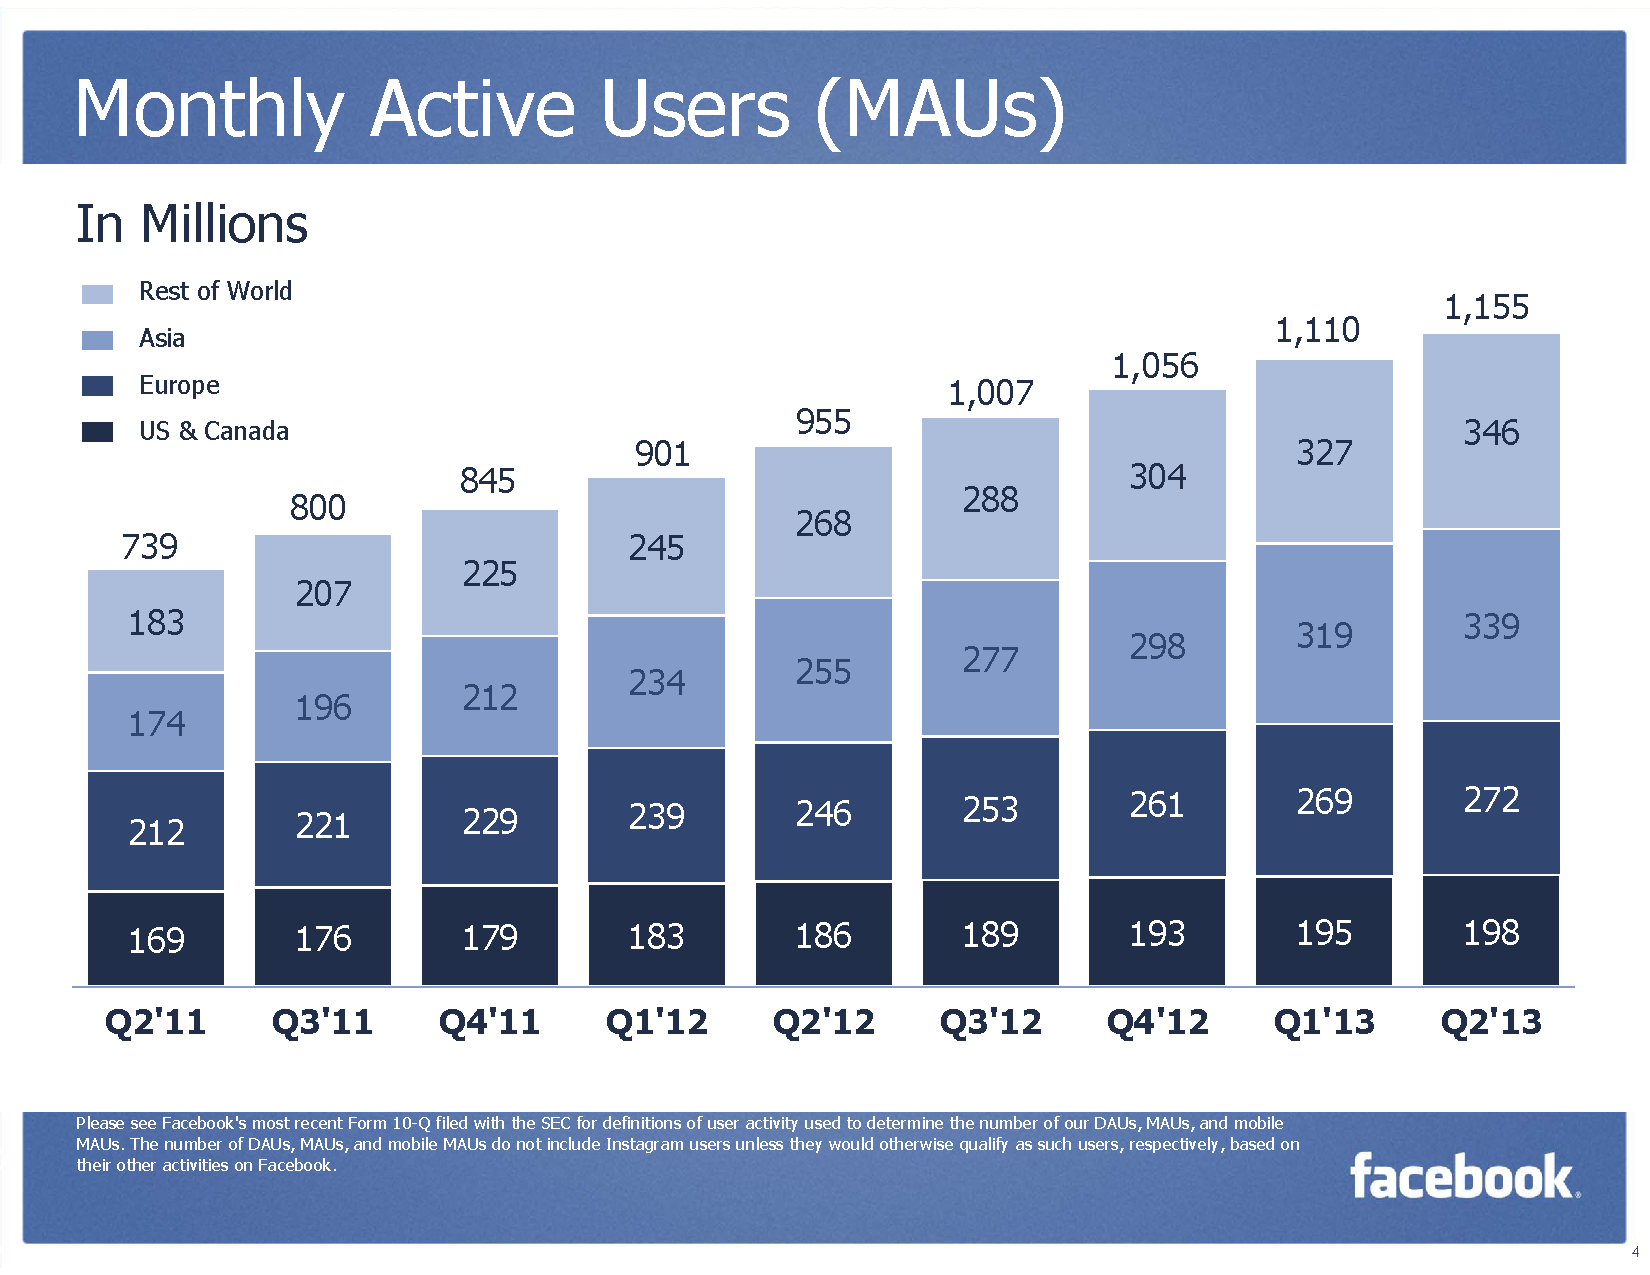
Facebook Monthly Active Users (MAUs) (Quelle: Facebook)
699 Millionen Nutzer sind täglich auf Facebook aktiv (60.5%). (Q1/2013 = 665 Mio.) 182 Millionen in Europa (66.9% der Nutzer in Europa), 181 Millionen in Asien (53.4% der Nutzer in Asien), 142 Millionen in USA und Kanada (71.7% der Nutzer in USA und Kanada) und 195 Millionen in den restlichen Regionen (56.3% aller Nutzer der übrigen Regionen). Die Zahl der täglich aktiven Nutzer hat in allen Gebieten prozentual zugelegt.
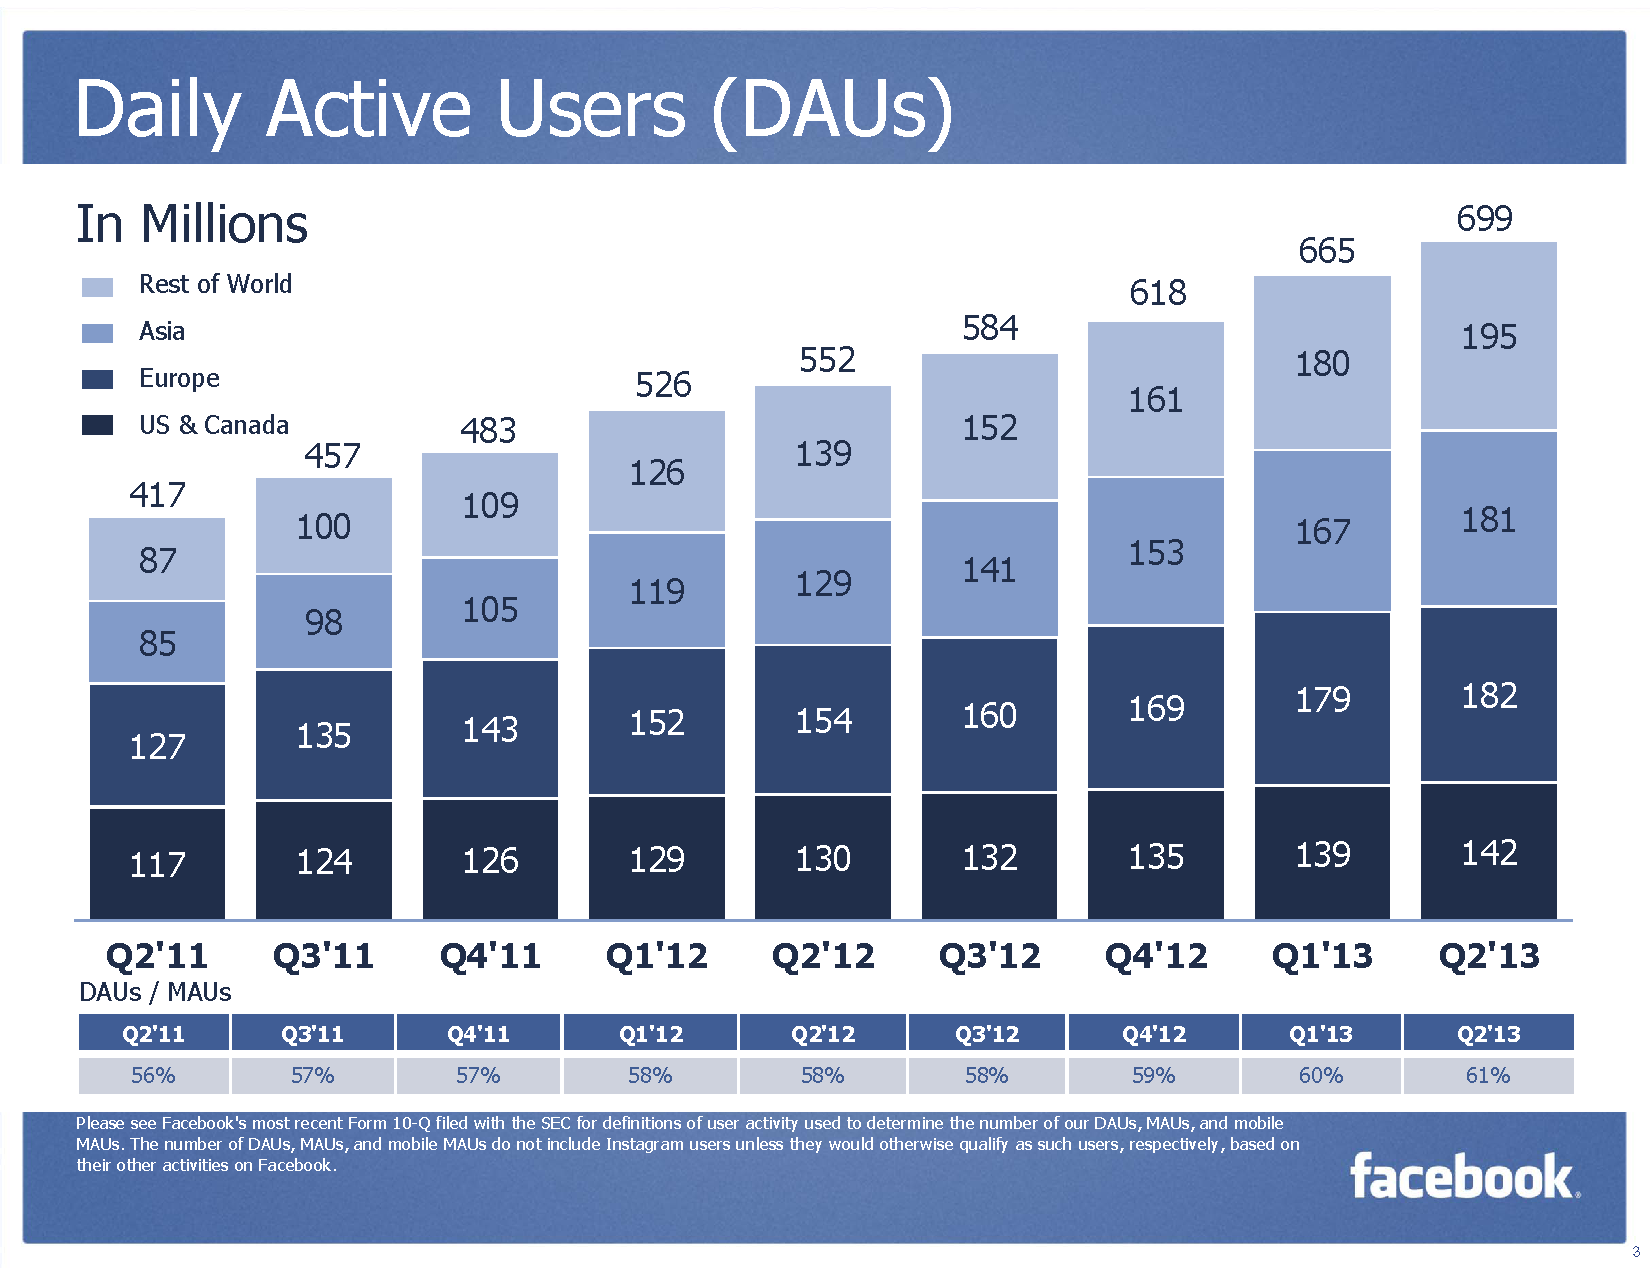
Facebook Daily Active Users (DAUs) (Quelle: Facebook)
Facebook verzeichnet 819 Millionen monatlich aktive Mobile Nutzer (Q1/2013 = 751 Mio.), was einem Anteil von 70.91% entspricht (Q1/2013 = 67.7%). Der Anteil der monatlich aktiven Mobile Nutzer ist gegenüber Q1/2013 in Q2/2013 überproportional angestiegen. Während die Summe der Nutzer in dieser Zeitperiode nur um 4.05% angestiegen ist, wuchs der Anteil der Mobile Nutzer in der gleichen Zeit um 9.05%.
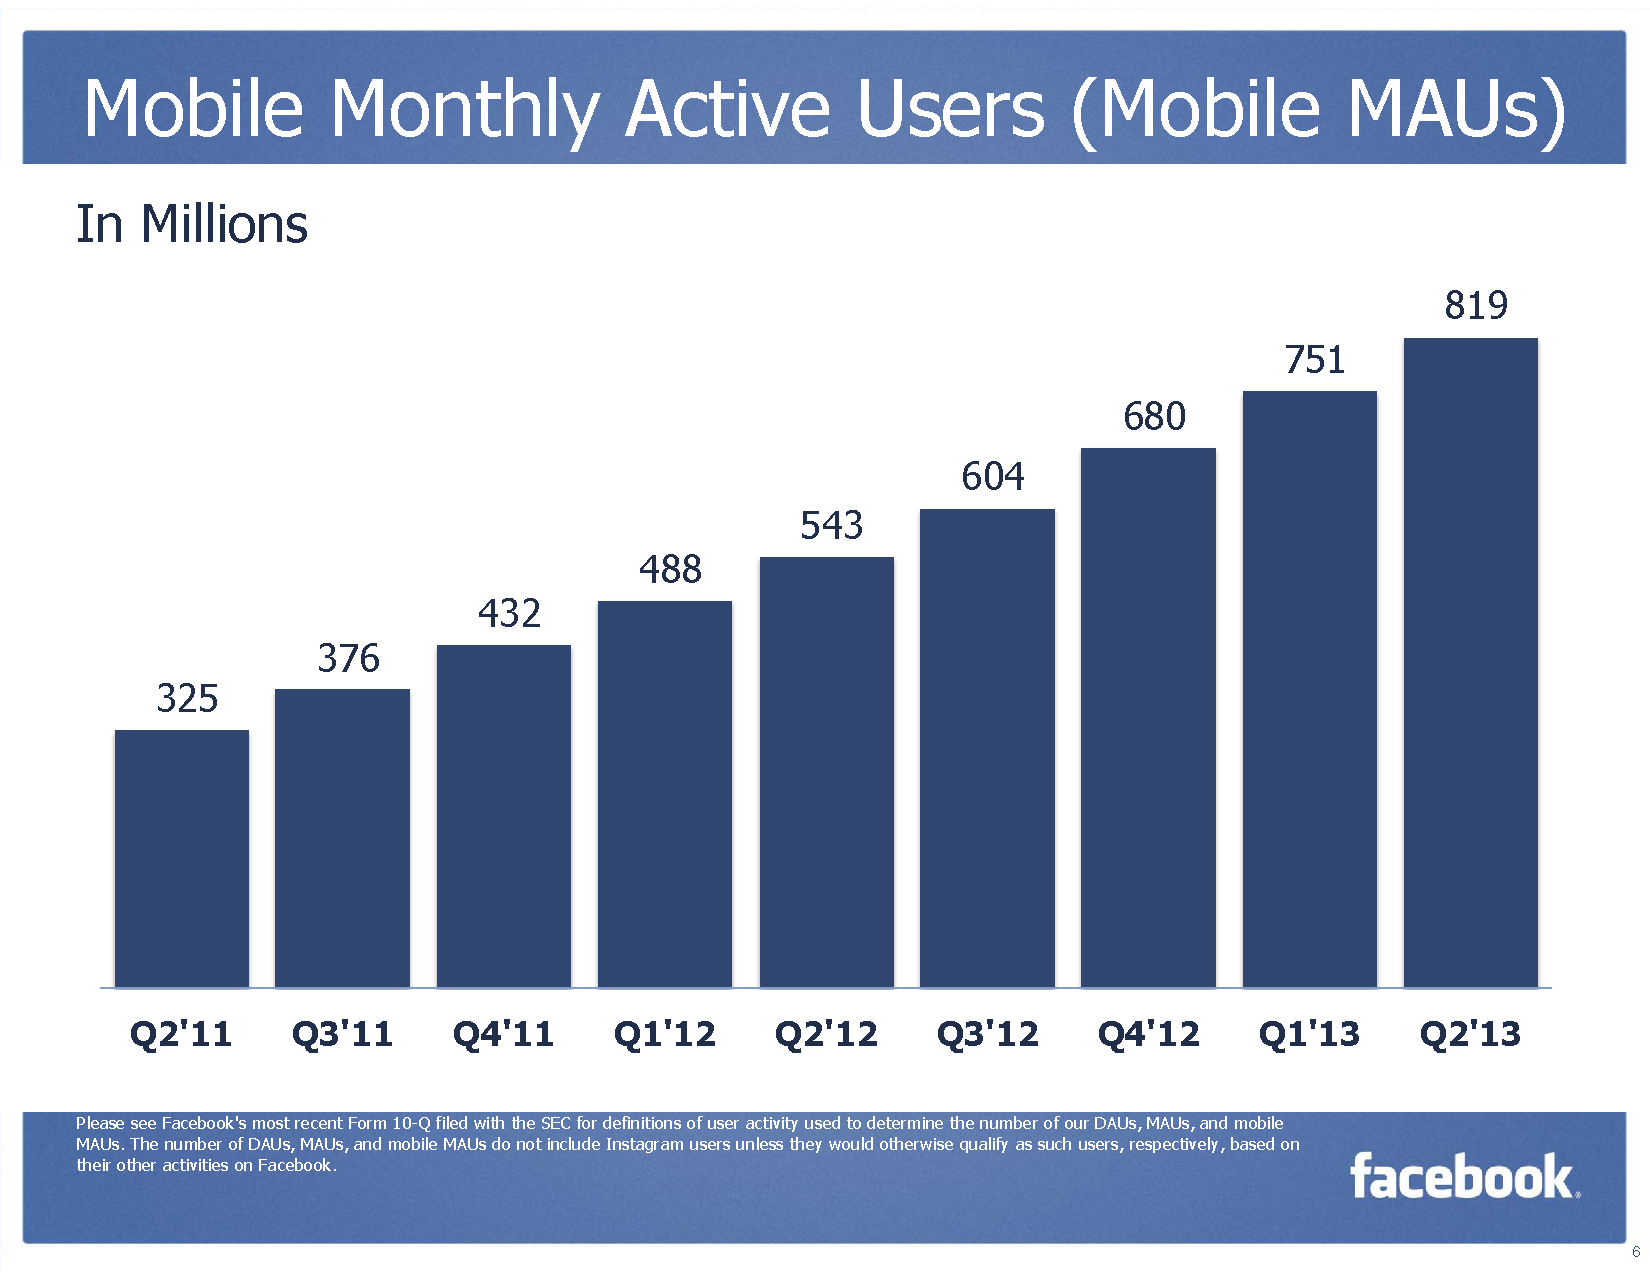
Mobile Monthly Active Users (MMAUs) (Quelle: Facebook)
Facebook weist per Q2/2013 469 Millionen täglich aktive Mobile Nutzer aus, was einem Anteil von 57.26% entspricht, in Q1/2013 waren es 425 Millionen, entsprechend ein Anteil von 56.59%, die tägliche Nutzung konnte somit auch im Bereich Mobile erhöht werden.
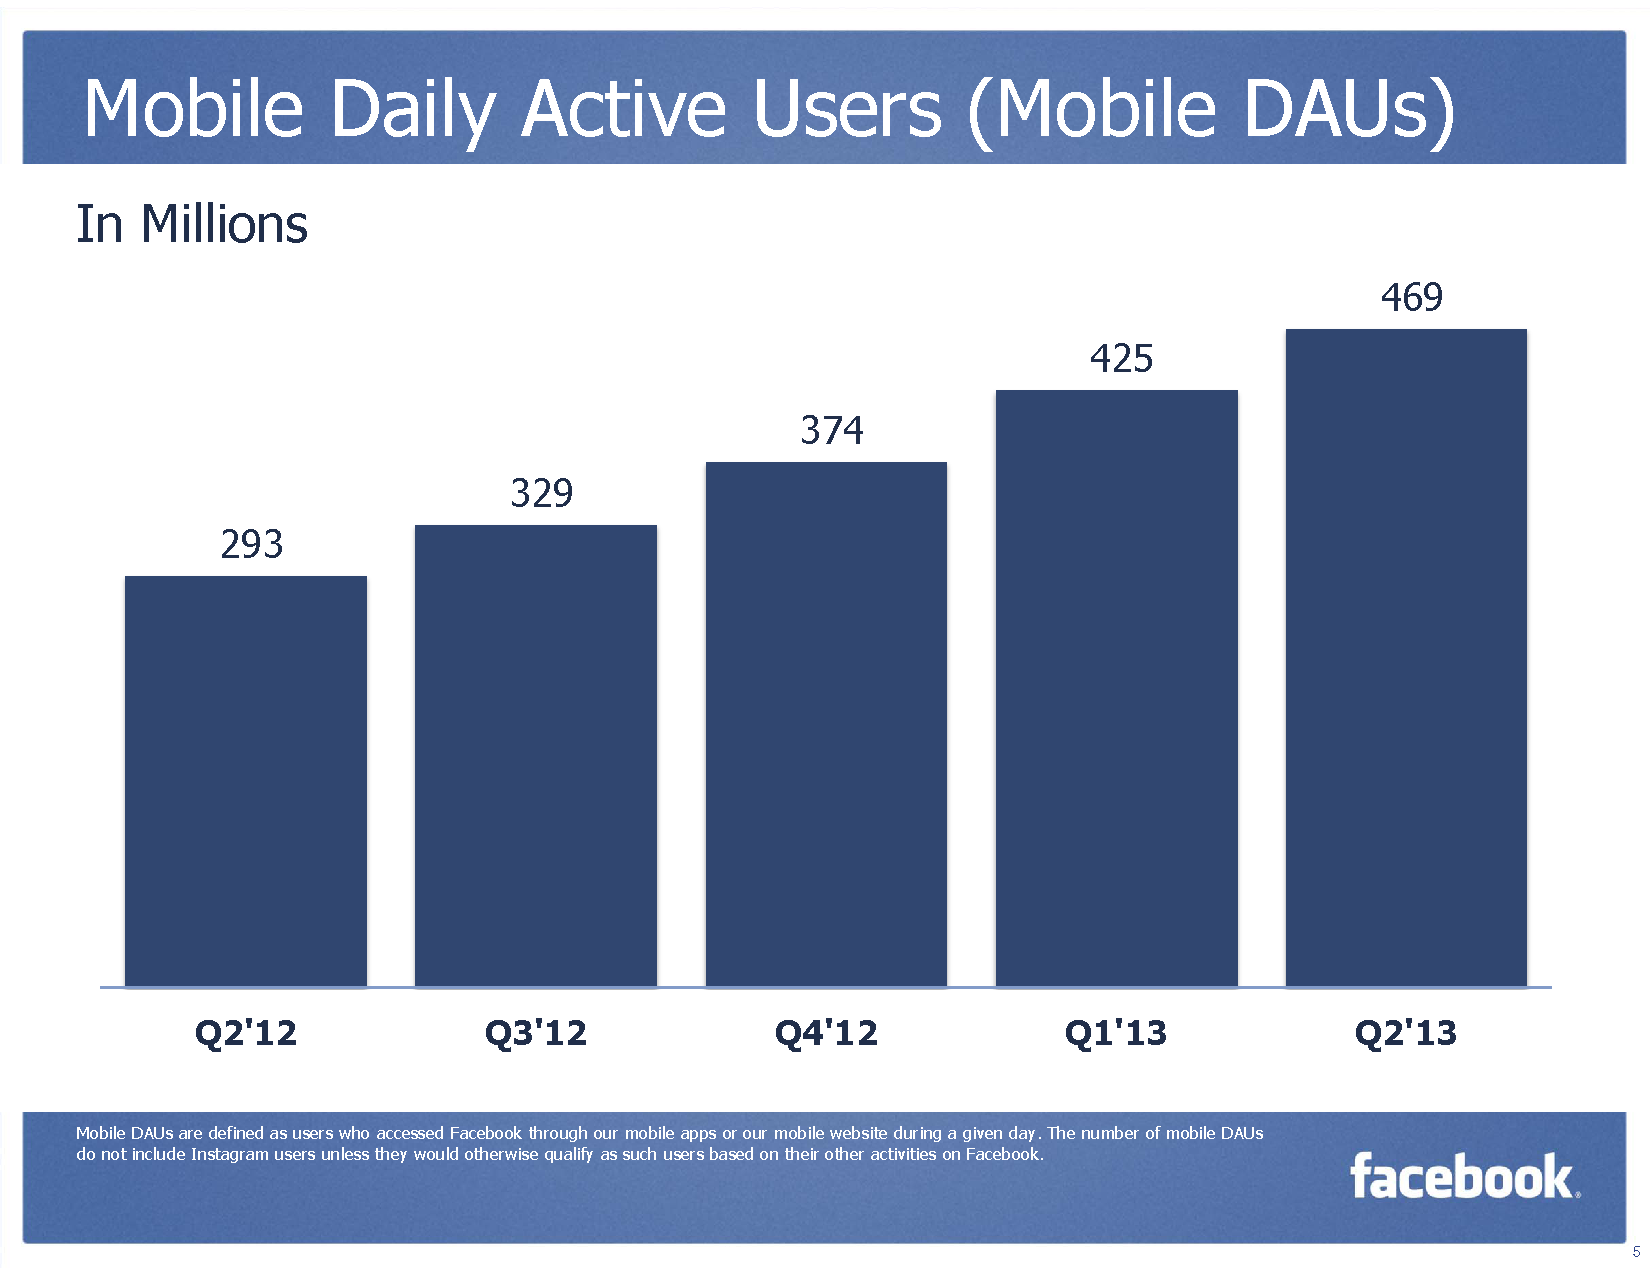
Mobile Daily Active Users (Mobile DAUs) (Quelle: Facebook)
Facebook weist per Q2/2013 219 Millionen monatlich aktive nur Mobile Nutzer aus (Q1/2013 = 189 Millionen). 18.96% aller Facebook Nutzer nutzen Facebook nur auf einem Mobile-Gerät, was einem Wachstum von 15.87% von Q1/2013 zu Q2/2013 darstellt.
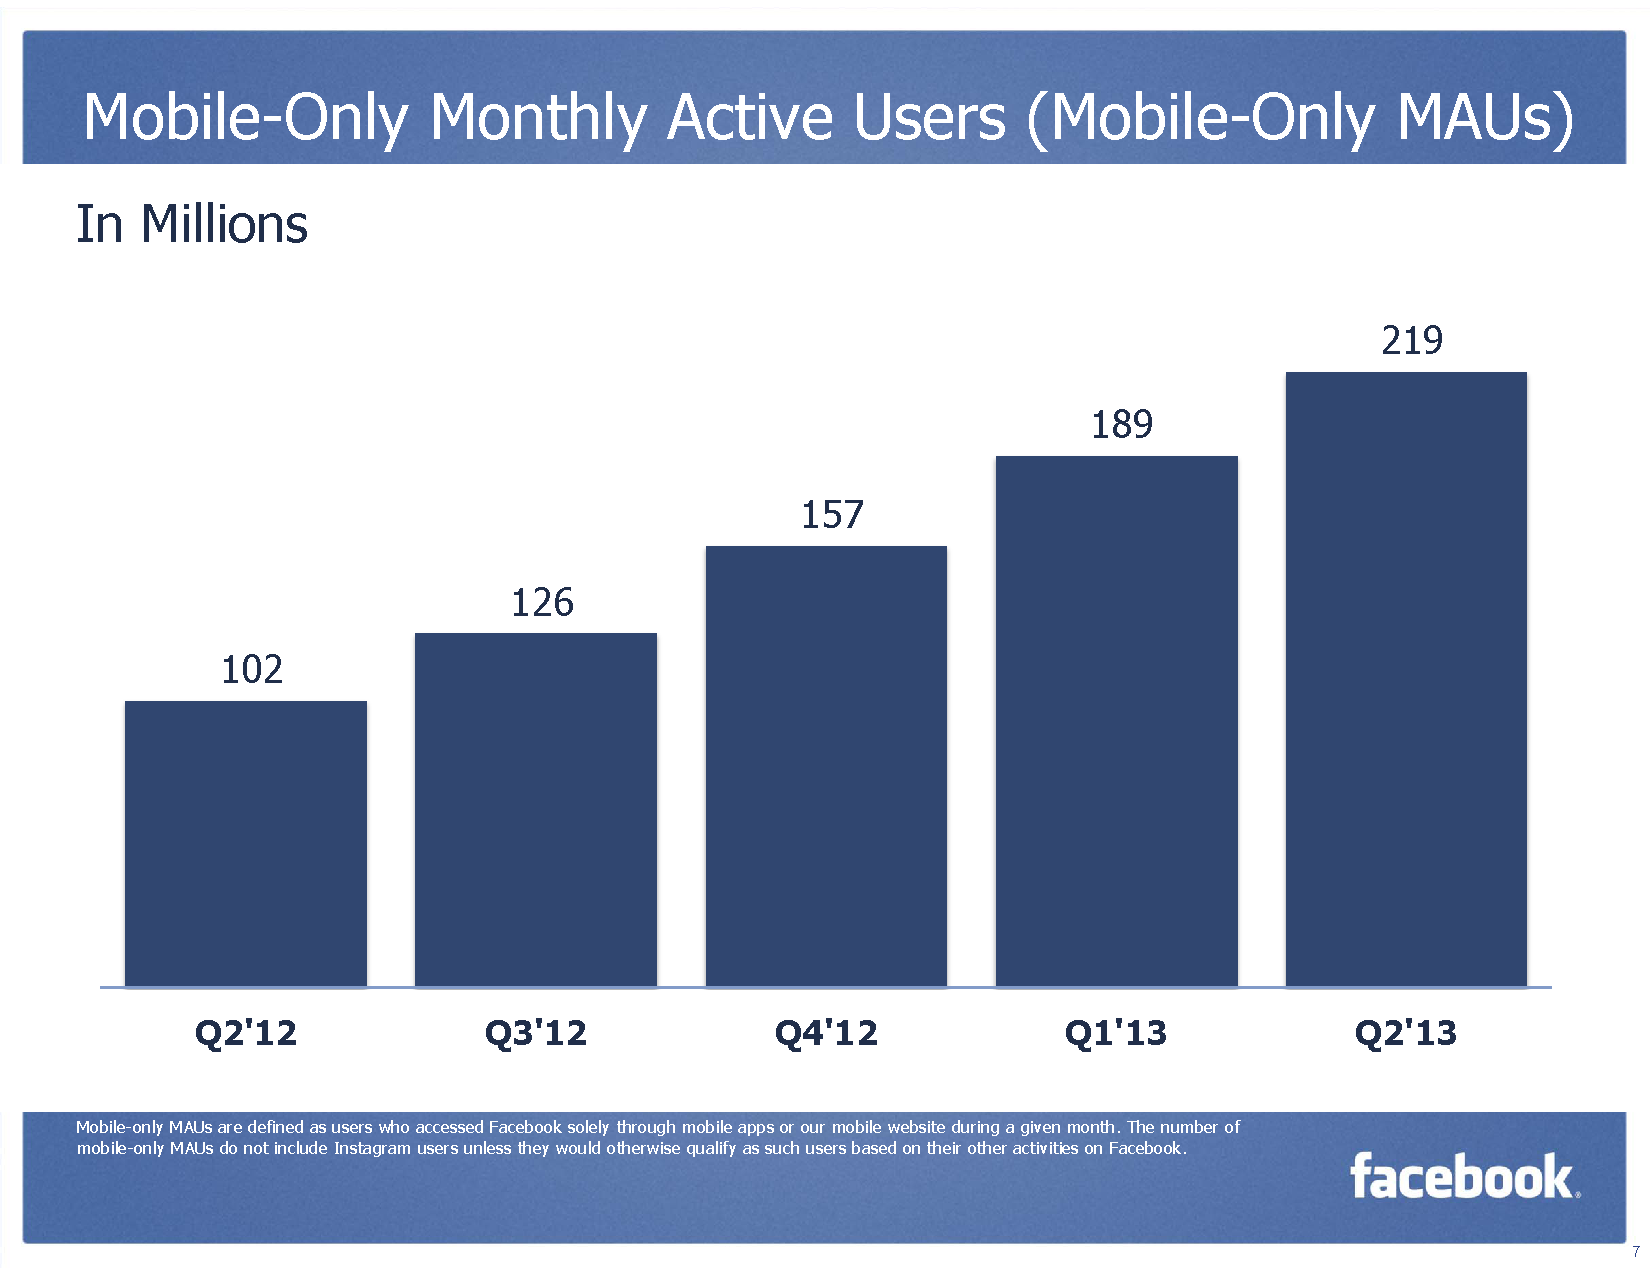
Mobile-Only Monthly Active Users (Mobile Only MAUs) (Quelle: Facebook)
Facebook erzielte in Q2/2013 1.813 Mrd. $ Umsatz, was einer Steigerung von 53.12% gegenüber Q2/2012 entspricht, bzw. einer Zunahme von 24.35% gegenüber Q1/2013.
848 Mio. der 1.813 Mrd. $ Umsatz oder 46.77% wurden in Q2/2013 in USA & Kanada erwirtschaftet, 27.85% oder 505 Mio. in Europa, 247 Mio. in Asien (13.6%) und 213 Mio. (11.7%) in den übrigen Regionen. Der Umsatz in Asien von Q1/2013 zu Q2/2013 lag bei 25.38% und wird von den übrigen Regionen mit 33.96% sogar noch überboten.
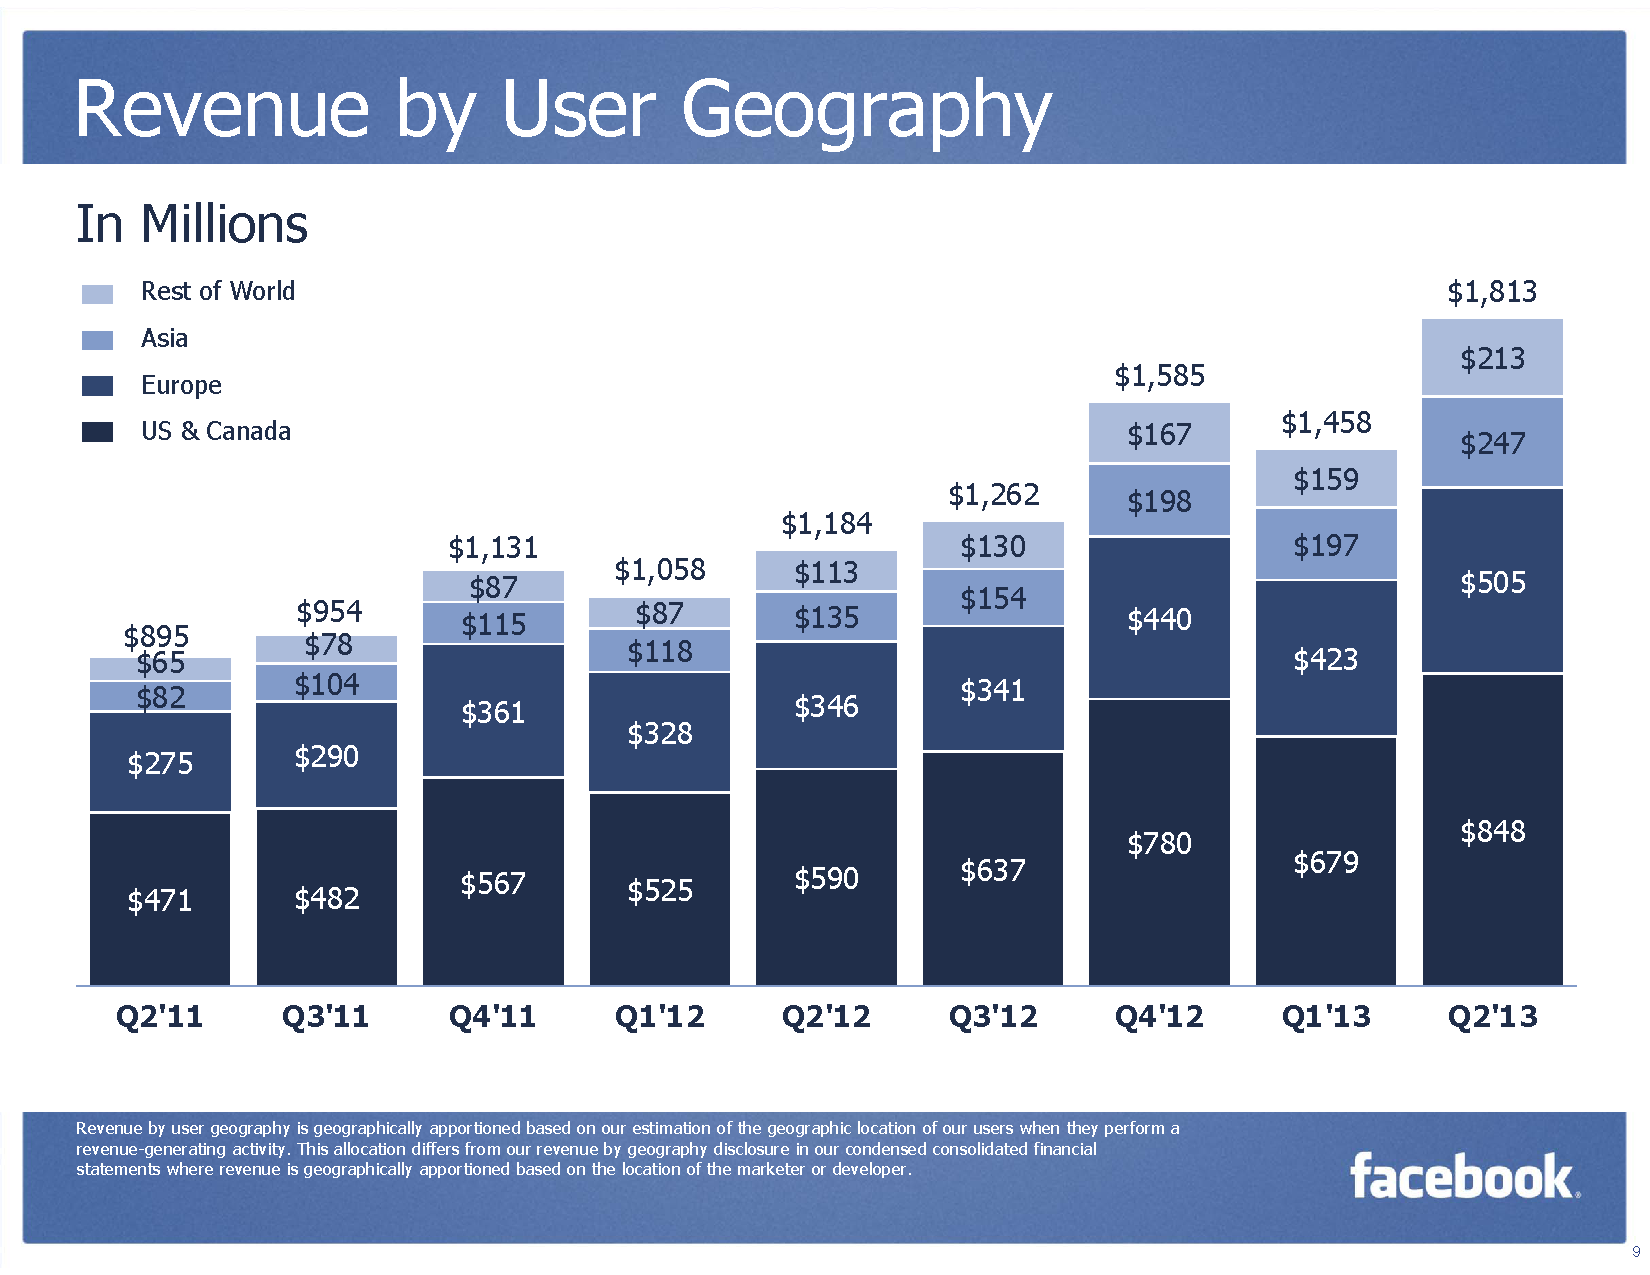
Revenue by User Geography (Quelle Facebook)
Facebook erzielte in Q2/2013 1.599 Mrd. $ Werbeumsatz, davon 721 Mio. $ (45.09%) in den USA und Kanada, 451 Mio. $ (28.20%) in Europa, 225 Mio. $ (14.07%) in Asien und 202 Mio. $ (12.63%) in den übrigen Regionen.
Der Werbeumsatz in Q2/2013 ist gegenüber Q2/2012 um satte 61.18% gestiegen. Die Steigerung gegenüber Q1/2013 beträgt 28.43%. Extrem hoch ist der prozentuale Wachstum gegenüber Q2/2012 in Asien mit 95.65% und in den übrigen Regionen mit 94.23%, während der Zuwachs in den USA & Canada “nur” gerade 43.72%, bzw. in Europa 45.95%.

Advertising Revenue by User Geography (Quelle Facebook)
Durchschnittlich macht Facebook in Q2/2013 1.60$ Umsatz pro Benutzer (Q1/2013 = 1.35$), in den USA & Canada sind es 4.32$ pro Benutzer (Q1/2013 = 3.50$), in Europa 1.87$ (Q1/2013 = 1.60$), in Asien 0.75$ (Q1/2013 = 0.64$) in Asien und nur gerade 0.63$ in den übrigen Regionen (Q1/2013 = 0.50$). Facebook macht also somit mit einem Nutzer in den USA und Canada den 2.31fachen Umsatz als mit einem Nutzer aus Europa und einen 5.76fachen Umsatz als mit einem Nutzer in Asien oder sogar den 6.85fachen Umsatz im Vergleich mit einem Nutzer in den restlichen Regionen. Der Umsatz pro Benutzer konnte im weltweiten Schnitt um 18.52% gegen Q1/2013 gesteigert werden.
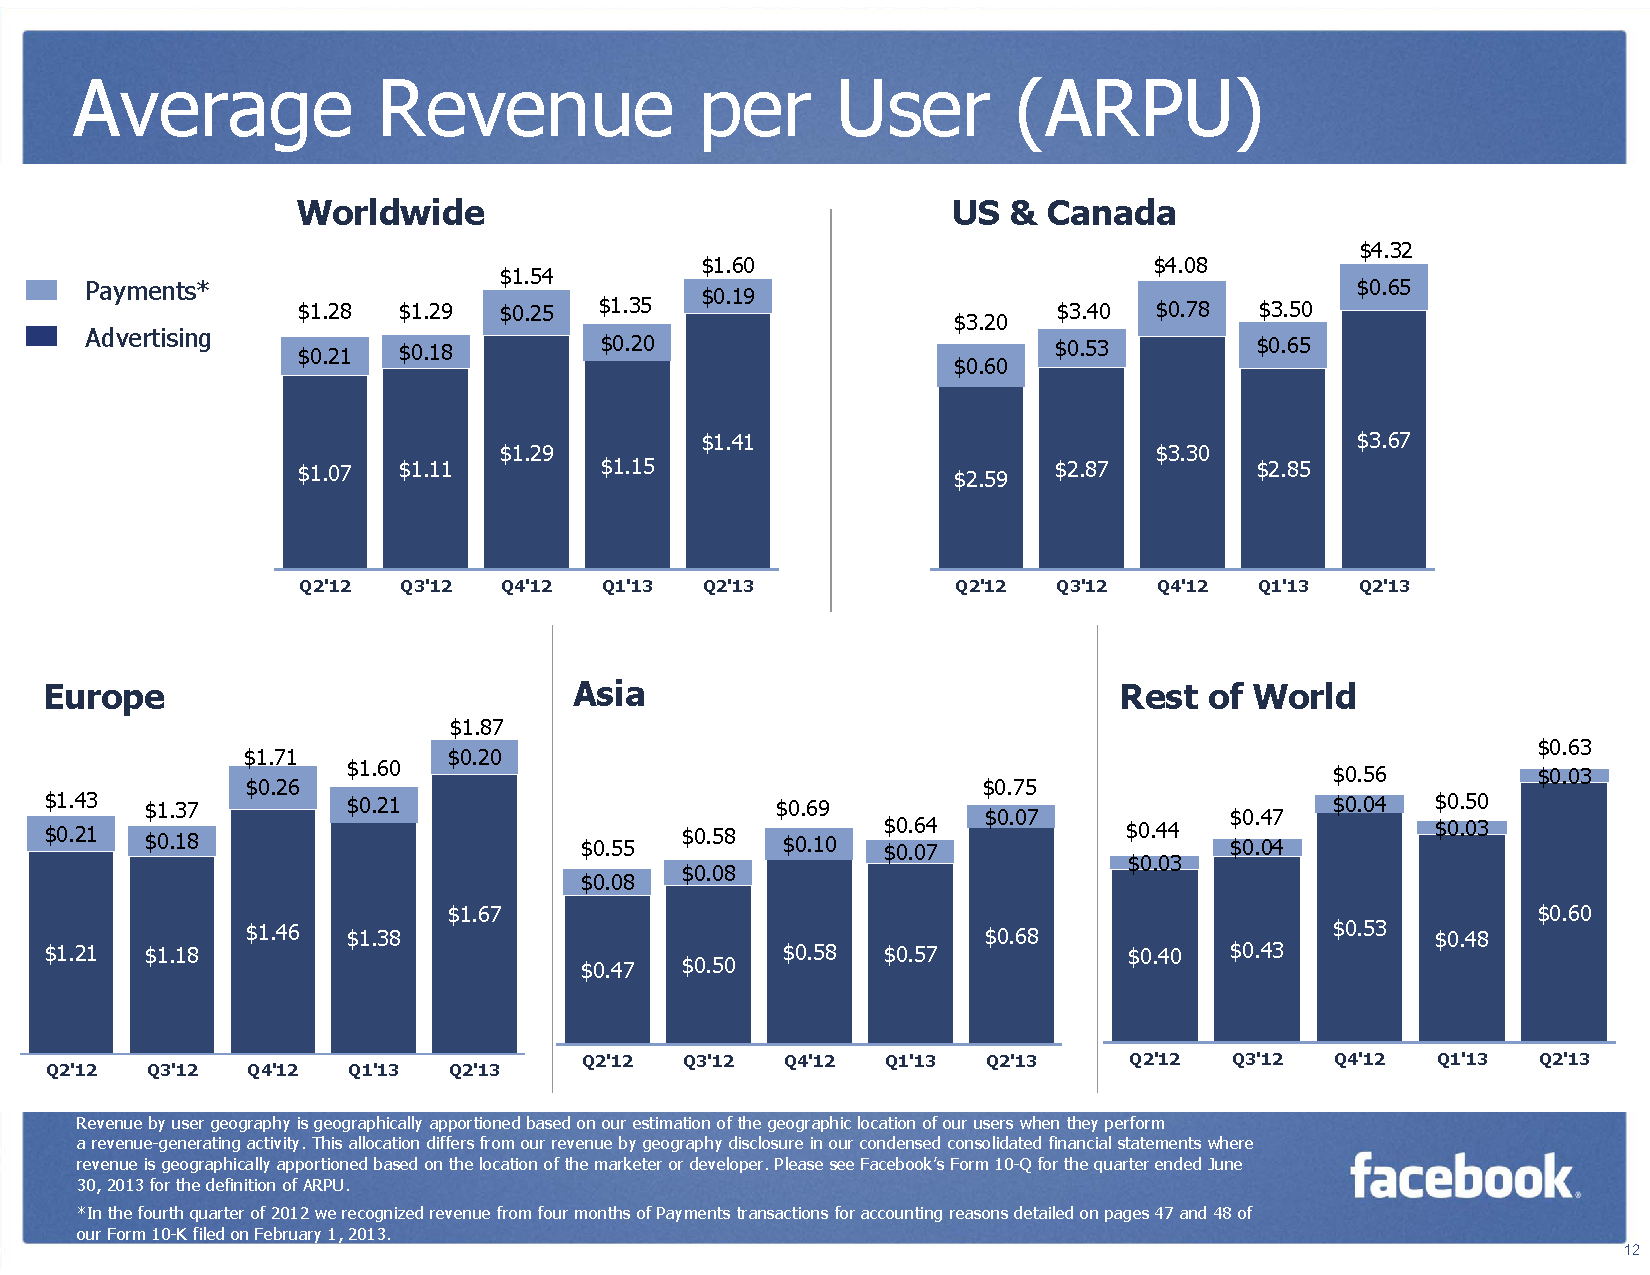
Average Revenue per User (ARPU) by Geography (Quelle Facebook)
Im Investorenreport vermerkte Facebook folgende Highlights:
Second Quarter 2013 Operational Highlights
- Daily active users (DAUs) were 699 million on average for June 2013, an increase of 27% year-over-year.
- Monthly active users (MAUs) were 1.15 billion as of June 30, 2013, an increase of 21% year-over-year.
- Mobile MAUs were 819 million as of June 30, 2013, an increase of 51% year-over-year. Mobile DAUs were 469 million on average for June 2013.
Recent Business Highlights
- Surpassed 1 million active advertisers on Facebook, driven by significant growth in local businesses.
- Introduced video for Instagram and saw 5 million videos uploaded in the first 24 hours.
- Facebook for Every Phone has now passed 100 million monthly active users. In just two years, Facebook for Every Phone has successfully putFacebook into the hands of millions of people around the world with limited access to the Internet, giving them the power to connect and share.
- Launched products including Verified Pages, hashtags and embedded posts to help people on Facebook connect with their friends about what’s taking place all over the world.
- Announced that there have now been over 100,000 apps built on Parse, a cloud-based platform that provides scalable cross-platform services and tools for developers to enable them to build apps that span mobile platforms and devices.
- Facebook’s data center in Lulea, Sweden, began serving live user traffic around the world using Facebook’s Open Compute Project designs and renewable energy.
Second Quarter 2013 Financial Highlights
Revenue — Revenue for the second quarter of 2013 totaled $1.81 billion, an increase of 53%, compared with $1.18 billion in the second quarter of 2012.
- Revenue from advertising was $1.60 billion, representing 88% of total revenue and a 61% increase from the same quarter last year.
- Mobile advertising revenue represented approximately 41% of advertising revenue for the second quarter of 2013.
- Payments and other fees revenue was $214 million for the second quarter of 2013, an increase of 11% from the same quarter last year.
Costs and expenses — GAAP costs and expenses for the second quarter of 2013 were $1.25 billion, a decrease of 35% from the second quarter of 2012, as costs in the second quarter of 2012 were materially impacted by the share-based compensation expense resulting from our IPO. Excluding share-based compensation and related payroll tax expenses, non-GAAP costs and expenses were $1.02 billion in the second quarter, up 52% compared to $669 million for the second quarter of 2012.
Income (loss) from operations — For the second quarter of 2013, GAAP income from operations was $562 million, compared to a GAAP loss from operations of $743 million in the second quarter of 2012. Excluding share-based compensation and related payroll tax expenses, non-GAAP income from operations for the second quarter was $794 million, up 54% compared to $515 million for the second quarter of 2012.
Operating margin — GAAP operating margin was 31% for the second quarter of 2013, compared to negative 63% in the second quarter of 2012. Excluding share-based compensation and related payroll tax expenses, non-GAAP operating margin was 44% for the second quarter of 2013, compared to 43% for the second quarter of 2012.
Provision for income taxes — GAAP income tax expense for the second quarter of 2013 was $212 million, representing a 39% effective tax rate. Excluding share-based compensation and related payroll tax expenses, the non-GAAP effective tax rate would have been approximately 37%.
Net income (loss) and EPS — For the second quarter of 2013, GAAP net income was $333 million, compared to a net loss of $157 million for the second quarter of 2012. Excluding share-based compensation and related payroll tax expenses and income tax adjustments, non-GAAP net income for the second quarter of 2013 was $488 million, up 65% compared to $295 million for the second quarter of 2012. GAAP diluted EPS was $0.13 in the second quarter of 2013, compared to a loss per share of $0.08 in the second quarter of 2012. Excluding share-based compensation and related payroll tax expenses and income tax adjustments, non-GAAP diluted EPS for the second quarter of 2013 was $0.19, up 58% compared to $0.12 in the second quarter of 2012.
Capital expenditures — Capital expenditures for the second quarter of 2013 were $268 million, a 35% decrease from the second quarter of 2012.
Cash and marketable securities — Cash and marketable securities were $10.3 billion at the end of the second quarter of 2013.
Alle Zahlen können unter Investor Relations auf Facebook detailliert betrachtet werden.
Autor: Thomas Hutter | 2033 Posts
Thomas Hutter ist Inhaber und Geschäftsführer der Hutter Consult AG. Er ist als einer der renommiertesten Facebook Marketing und Social Media Experten im deutschsprachigen Raum bekannt und wird gerne auch in den Medien als "Facebook Guru" oder "Facebook Papst" tituliert. Mit seinem Team berät er grosse und mittelständische Unternehmen, Organisationen sowie Agenturen in und rund um Facebook und Social Media Marketing. Mit seinem Blog "www.thomashutter.com" legte er 2009 den Grundstein der Hutter Consult AG. Sein Blog gilt nach wie vor als eine der wichtigsten Ressourcen zu aktuellen Entwicklungen im Bereich Facebook und Social Media Marketing. Sein umfangreiches Wissen trägt er als Dozent an Fachhochschulen und als Referent in der DACH-Region an Teilnehmer weiter. Man trifft ihn auf Branchen-Konferenzen als Speaker und Mentor hautnah, live und in Farbe.


